
Bollinger Bands AKA Bbands- Basics, Strategies and Visuals
Bollinger Bands AKA Bbands- Basics, Strategies and Visuals
By @HackermanAce


This article will cover the basics on Bollinger Bands or what you will hear me refer to them as is Bands, there are plenty of strategies but ill discuss a few that work with Ichimoku . They were invented by John Bollinger and you can read his article about the back story behind it as well some more info on his website(Click Here). Now in this article ill explain the basics features and the way I use them in my analysis on charts as well as why I decided to use them. You’ll also find examples of a few basic strategies I use and that we have been using to nail all the recent Gold tickers in the stock market. This can be applied to crypto markets and not only stocks , also it can be used on any time frame given you are adjusting risk if switching to lower time frames.
Lets get started, Bbands has 4 visual components that you will see when you add the indicator onto your charts via any charting platform. Colors may vary but please adjust them to what visually suits you or makes your charts cleaner.
We have the following:
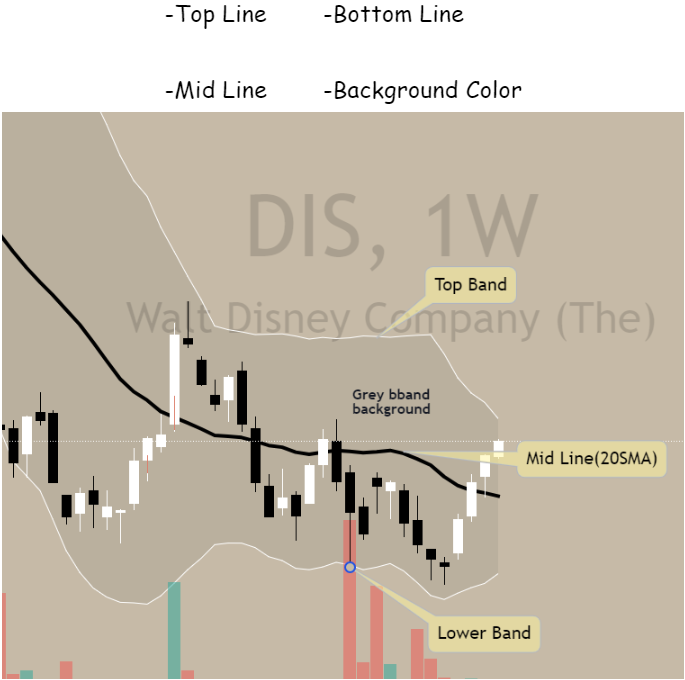
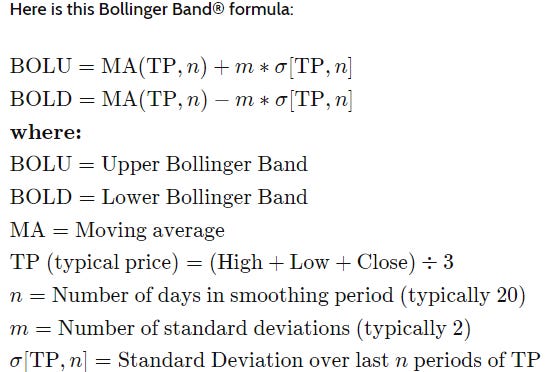
For my technical learners & coders ill link an image of the official formula below. The Bbands consist of a 20 SMA which is the mid line with the upper and bottom line being formed using 2 standard deviations+/-. The shaded background is a visual tool depending on you chart scheme so that can be adjusted or removed.
I started using Bollinger Bands for several reasons with the main one being me trying to add-on to Ichimoku to find LTF or Macro tops and bottoms after certain conditions were met. It was frustrating solely using Ichimoku as id miss moves prior or after crucial Ichimoku signals like TK crosses or Cloud Entry reversals. You can read my article on Ichimoku basics by clicking on this link. Also its a great indicator for spotting potential volatility points on the price action which added as a confluence factor with my Ichimoku strategy. You’ll find some basic examples below of what I look for, if you have joined my streams you should know what these are.
Price Extensions & Consolidation
Below you will see the simplest use case that you can start identifying on the chart. This will be Price Extensions , this means when the price extends on either the Upper or Lower Band as you can see below. Some refer to this as being oversold (Cutting the Lower) or overbought( Cutting the Upper) but that shouldnt be your only reason for taking a trade. In my strategy when ever we have a extension this results in consolidation or a mean reversion before the next move. On the example below, the Lower Band has a price extension causing a bounce, the Upper Band also has a price extension causing a pull back. Both result in some form of consolidation before the next move price action move. These extensions are used with Ichimoku to identify Tops/Bottoms or early reversal signals before a cloud entry for either bullish or bearish scenarios. Keep in mind the time frame you are using, if using a macro time frame you HAVE to adjust your expectancy on when the price will mean revert or simple continue in trend. This means if you are using a weekly time frame , understand it will take a few candle before consolidation is complete before the next leg but if your using the 4h then the price may finish consolidating within 1-2 days, ALWAYS pay attention to price reactions in accordance with the time frame you use.

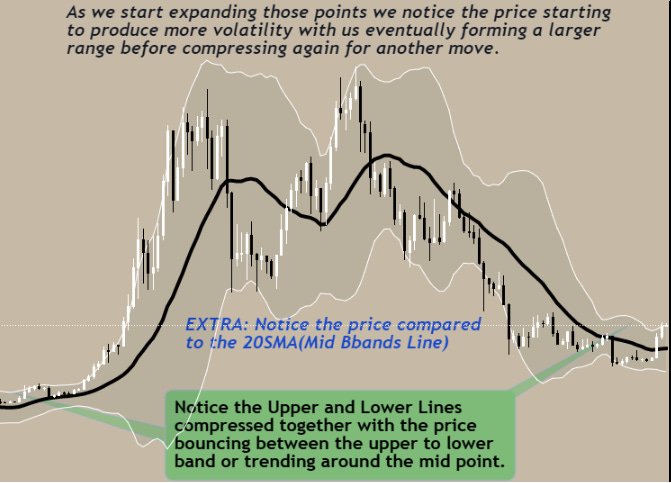
Bbands Squeeze’s & Volatility
We have all heard a traders say “big move soon” or “Vol incoming” well with Bbands you can identify these points in the price visually . This is known as the Bbands squeeze, this is when the bands tighten up with it eventually ending up riding the bands either up or down depending on breakout. In the example below we see 2 points where the bands tightens for a squeeze, on the left before a bullish ride up and on the right which is current PA on bitcoin waiting for a squeeze. Using this technique with Ichimoku means you can identify potential cloud entry point and exit points. When using with Ichi , you will see a Cloud E2E play or a FTA breakout and both of these work regardless of if you are looking for a bullish play or a bearish play.
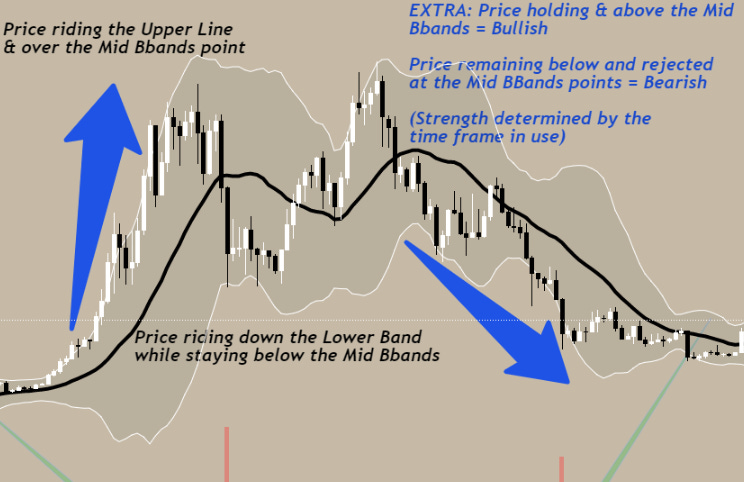
The Mid Bbands Line AKA the 20sma
This line is what I use as a mid point between then Tenkan n Kijun Points on Ichimoku. The main triggers I’m looking for a hook formations prior to cloud entries and this can be for either bullish or bearish setups. The second is a very simple method, looking for flips or rejections of the mid point after a consistent trend, this is more effective when using it on a macro time frames. While trading on lower time frames can work, its not recommended for people who have no idea what they are doing in the first place or trying to develop a learning base for trading. Below is a example of the strategy in place via a higher time frame. Notice how on the left it acts as support before a ride up and then acts as resistance as it goes down. These visual flips on the daily or weekly are typically supported by Ichimoku if you have it on. The last part of this which is the hooks is something ill discuss in my next article as I use the hook method in conjunction with Ichimoku to identify tops and bottoms PRIOR to cloud entries, if you have joined my stream well you should exactly what I’m talking about.
Summary
I hope this helps you get a basic understanding and a few tips you can use when going thru your charts. Bbands can be used alone but only if you understand how and when to use it. I use it in combination with Ichimoku to strengthen Ichi signals so it gives me a better idea of the risk involved in taking the play and if I see confluence with both indicators. I’m willing to take the risk more often when there are multiple confluent factors vs when there is only 1 set of confluence. Its not something that gives target ,entry , exit and stop loss points like Ichimoku does but rather gives you a idea of where the trend is and what might happen at those points. Join my stream at any time and id love to give previous trade examples or current on going ones in detail. Below are some links you can go thru and just some more info regarding my content.
Links:
A thread of previous use cases of Bbands strategies I’ve used successfully.

You can also scroll thru my entire feed by clicking below this is all the times I’ve tried to explain it. You will see all the topics mentioned above at some point
Click the stream button to follow me on Twitch , the schedule will be back at 3pm EST Monday thru Friday covering both stock markets until close followed by all things crypto after 4pm EST. With the occasional stream on the weekend at 9pm EST on either Sunday or Saturday depending on my viewers request.
Lastly if you want to chart somewhere its the easiest and with the most features on Trendspider which you can sign up for with this link if you click here. Outside of that I don’t have anything to shill but do ask if you can like and retweet the post so it can get some exposure that would be great! Feel free to comment as well if you have questions or if you have any article requests.
Hope it was a worth while read! Have a great week and 2023 frens!
